Server Performance: 10 Best Web Server Performance Metrics
- January 15, 2018
- 0
Did you know how to monitor server performance? Are you aware of Sql server counters for monitoring sql server performance? Here, we are discussing about some of the best web server performance metrics. In this era where consumers are obtained and dropped within a fraction of second, regular evaluation of web server performance are required.
There are many important server performance monitoring tools, software which helps you to evaluate the performance, There are also metrics that allow to evaluate the performance of your server termed as “key performance indicators”. They are stated below.
Web Server Performance Metrics
Requests per Second (RPS): It is the most important web server performance metrics. RPS is the metric that helps to evaluate how many requests per second are being sent to an end server. This metric is also termed as the Average load. It allows you to learn what load your web application currently works under. Normally, this is measured as a count of the requests obtained during an analysis period, where the period is denoted in seconds. Usually, the monitoring period should be in the range of 1 to 5 minutes. The lagging of the monitoring period is an unsuitable load indicator.
Error Rates: Under huge loading, there are chances for errors when requests are processed which is considered as natural. The Error Rate is measured as a percentage of problem requests corresponding to all requests, and it reflects how many response HTTP status codes indicate an error on the server, including requests that have not get a response ever (timed out). It is identified that web servers return an HTTP Status Code in the response header. Normal codes are usually 200 something in the 3xx range, showing a redirect on the server. Common error codes are 4xx and 5xx, which indicate the web server recognizes that it has a problem fulfilling that request. Error Rate measures “performance failure” in the application and tells how many failed requests have occurred in a duration of time. Whatsoever, it is suggested to minimize likely errors in order to avoid performance problems.

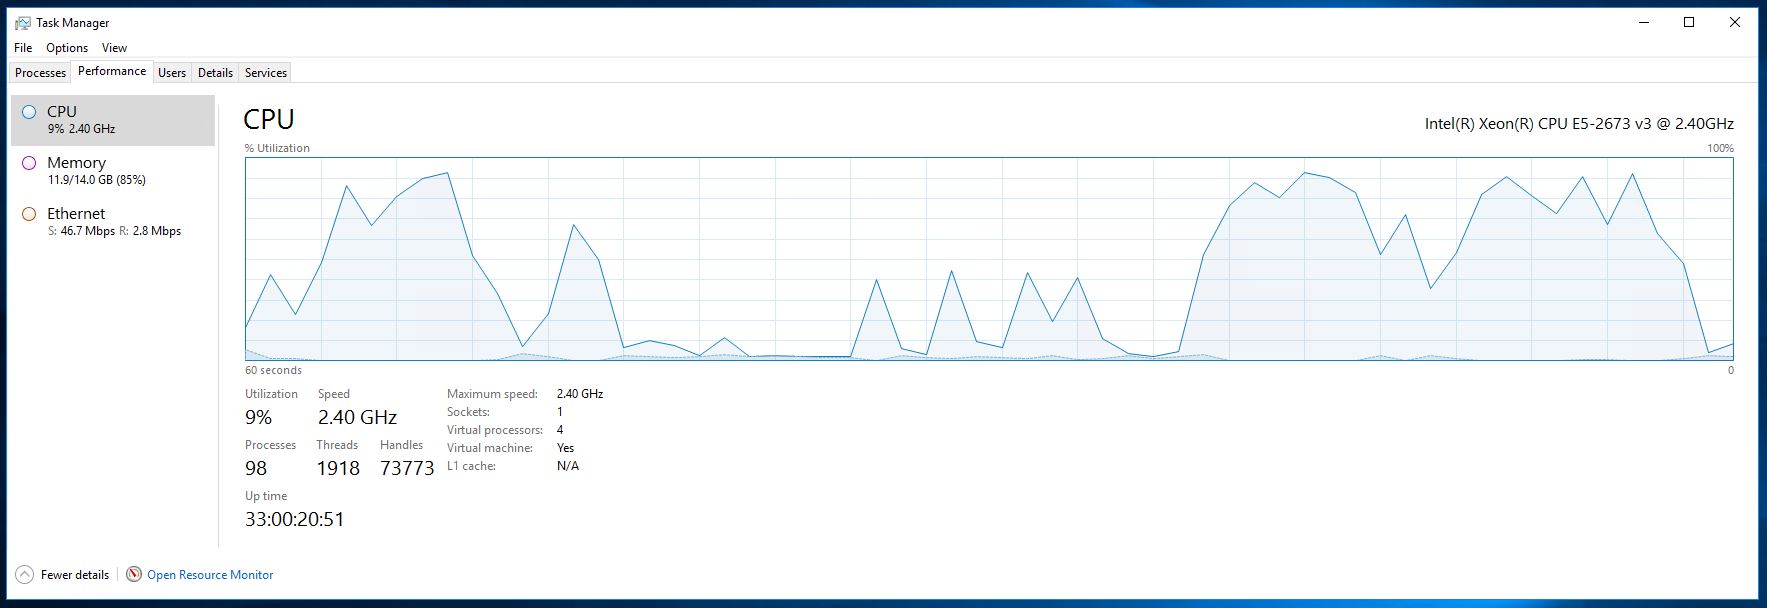
CPU Utilization: CPU Utilization is the amount of CPU time used by the Web Application while preparing a request. Normally, it is the percentage of CPU method that is measured, which indicates how much of the processor’s capacity is currently in use by your application. When the percentage of CPU usage begins to max out at 100%, an extra action may need to be taken because it points to the existence of some problem in the application, or to a potential lack of the host machine.
Bytes per Second: This metric measures the volume of information being carried in and out of the server. This metric can be used as an indicator of server performance, relative to limitations such as network infrastructure.
Average Response Times (ART): By estimating the span of every request/response cycle, it is possible to evaluate the duration taken by the target web application to generate a response. The Average Response Time takes the length of all round-trip request to response cycles during a Monitoring period, and computes the mathematical average of all the response times. The resulting metric is a representation of the speed of the web application. The standard unit of measurement for ART is advised to be in milliseconds.
Peak Response Time: While the average response time presents an insight of web server performance from the user’s viewpoint, the peak response time metric will help recognize areas where performance could be recovered. For example, it is good that average response time to be one second, but within that average, there could be an element taking 10 seconds to load a request. The peak response time metric also picks slow elements within the application that should be examined and improved.
The Count of Threads: In general, a web application generates a lot of thread to process requests. The number of threads per process is restricted by the system and it is a significant metric. So, if your application makes too many threads it can be a notice that you have a problem with the application. Certainly, the count of existing threads is relative to the load and disproportional to the processing time of the requests.
Uptime: Uptime is the amount of time that a server has been ‘Up’ and working properly. It is one of the crucial web server performance metrics. It reflects the authenticity and availability of the server and the value should be as large as possible. The value can be measured as an absolute value or as a percentage of actual server uptime to ideal server uptime. Normally, if your server is in production, a value less than 99% should lead to consideration and less than 95% to troubling.
Memory Utilization: Memory Utilization is the amount of memory used by a Web Application while processing a request. Usually, it is determined as the percentage of memory utilization by a processor, which is a ratio of the Resident Set Size to the physical memory. Remark that the Resident Set Size which is space for text, data, stack, etc. is a real occupied memory size.
The Count of Open Files Descriptors: A file descriptor is an object that a process utilizes to read or write to an open file and to open network sockets. This is why it is also an important web server performance metrics to be taken into consideration. An Operating System puts limits on the number of file descriptors that a process may begin. A shortage of available file descriptors can cause many types of symptoms which are not always clearly traced. The Open Files Descriptors (OFD) give a sum of the total number of file descriptors that are currently assigned and ready for processing. The percentage of the total number of open file descriptors with respect to the maximum permitted count of descriptors for processing is a good metric for assessing the strength of a web application.
Through repeated analysis of these analytical metrics, it is easy to catch where the Web servers need improvement.
Apachebooster is a well known CPanel plugin that combines the features of Nginx and Varnish, which is an affordable solution to all your server problems.
Moreover, we assist our clients and customers anytime they need! If you didn’t try this yet, Try ApacheBooster Now to boost your server performance.